

I have some great news, because having had a talk to industry experts I believe we can expect Perth to continue outperforming the national average in sales and property prices despite rising interest rates!

As an award-winning building consultant, property development and subdivision expert in WA, it’s my job to stay abreast of the Perth market. And, in my experience, the Perth building industry is heavily influenced by the state of the economy and follows a similar trend to that of the Perth property market.
While this point in time is marked by speculation and uncertainty, I got in touch with Ryan Briety – Housing Economist and RIEWA Data Analyst – to bring you an expert insight on the economy, interest rates and the property market. He shed some light on the positive outlook for buying and owning property in Perth in 2023, see his assessment of the market below.
The two major opposing factors impacted Perth’s property prices in 2023
- Increased interest rates to combat inflation
- Increased migration with the borders re-opening
Let’s take a deep dive into these two factors.
Inflation
Inflation dramatically increased this year, driven by labour shortages, supply chain disruptions and increased consumer-driven demand. The first chart shows how inflation increased over the past 12 months catching the Reserve Bank of Australia (RBA) by surprise.

The RBA reacted to the inflation rate well above their upper 2% target range by increasing the cash rate, starting in May 2022, at a rate not seen since monetary policy was utilised to control inflation in the early 1990s. The next chart reveals how the current rate of increase compares historically.

The increased cash rate caused a significant decline in most capital city dwelling prices, with Sydney prices recording the greatest drop, falling by more than 11.5%, as illustrated in the next chart. While Adelaide was the best performing suburb, their prices are now showing a slight decline, while Perth prices are holding steady.
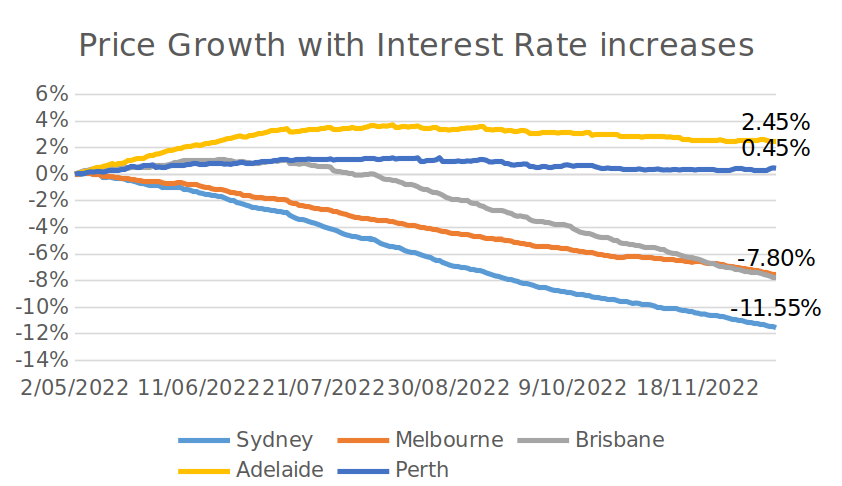
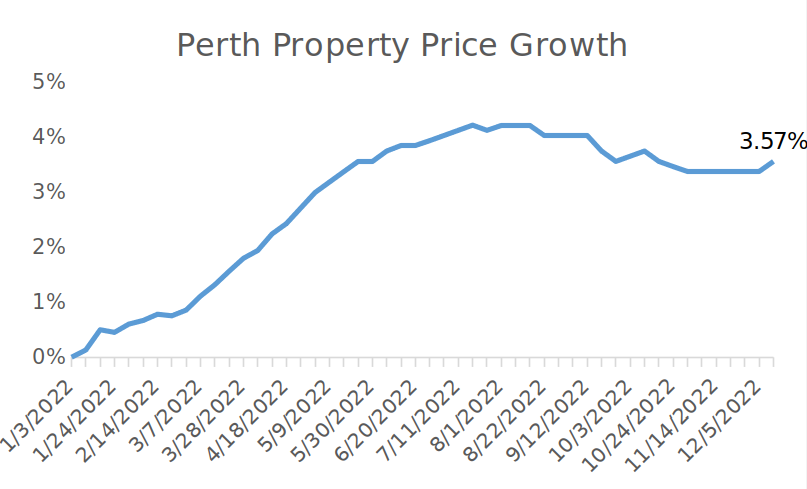
This week, Perth property price resilience was demonstrated again and continues to outperform the national trend, recording a 0.18% increase for the week and a 3.57% increase for the year. We were hoping Perth could hang on for a 3.38% increase for the year, but as the following chart reveals, we may finish the year stronger.
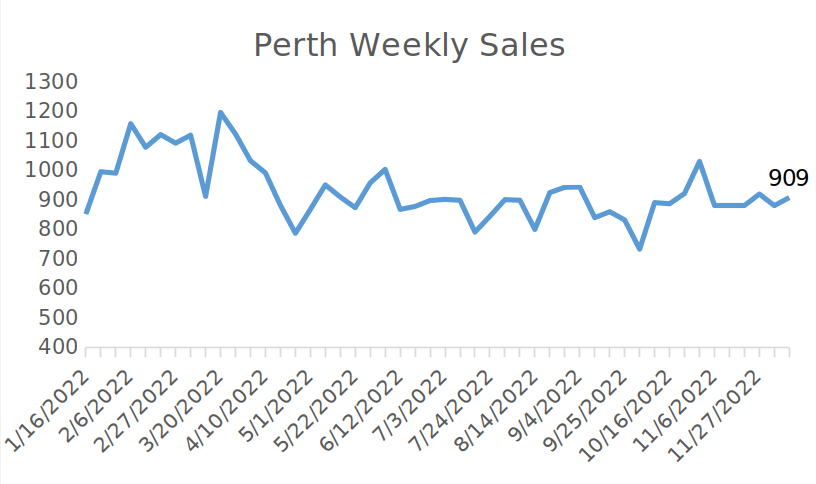
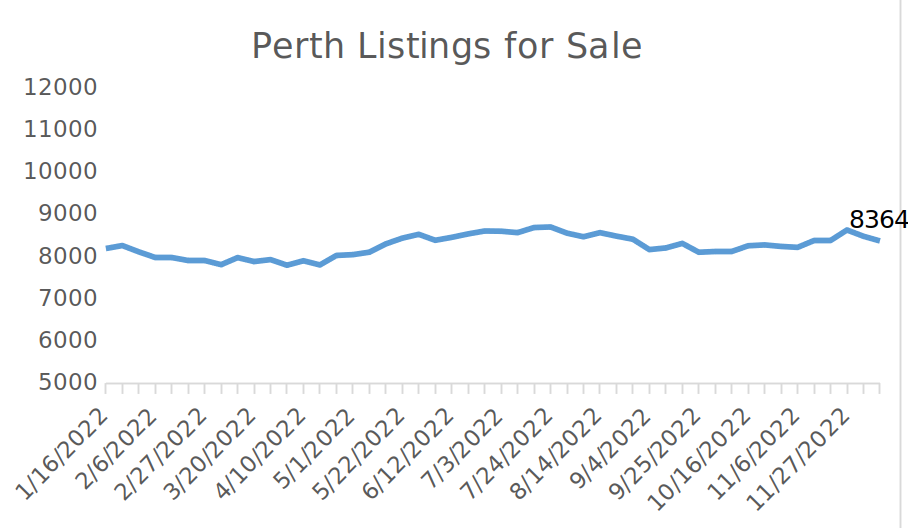
The ability of Perth’s prices to buck the national trend is due to affordability, continued demand coupled with limited supply, historically strong employment and increasing migration. The following two charts reveal that the increases in interest rates starting in May did not significantly affect the supply and demand represented by the number of listings for sale or weekly sales this year.
Migration
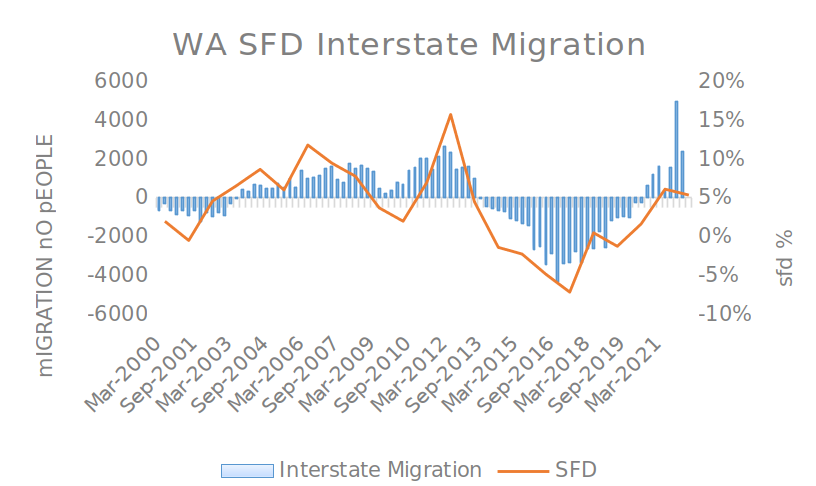
One of the main reasons for consistent demand was increased interstate migration during the Covid period. Employment is highly reliant on economic activity and is the primary driver of interstate migration, which profoundly affects Perth dwelling prices. The next chart demonstrates the correlation between WA economic activity measured by State Final Demand and interstate migration.
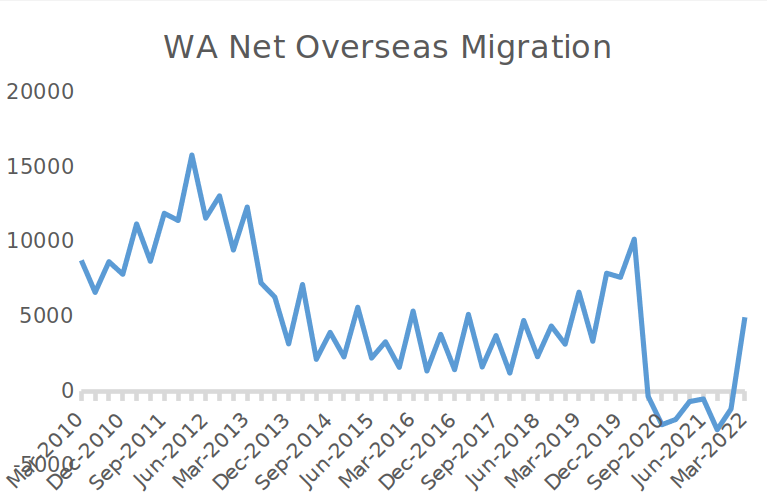
At the same time, overseas migration has increased with the opening of international borders. Before the six quarters of negative overseas migration during the pandemic, WA had only recorded one-quarter of negative overseas migration back in September 1993. However, WA’s current period of positive interstate and overseas migration is the first time since 2013.
What’s the takeaway?
It’s important to highlights that WA dwelling prices often do not follow the national trend, and rising interest rates does not automatically imply that dwelling prices will fall. For those who can remember, the RBA increased the cash rate from 4.25% in 2002 to 7.25% in 2008, and Perth property prices increased significantly during that period.
While Perth continues to record strong migration, supporting demand and supply levels remain low. With good employment opportunities, we expect Perth to continue outperforming the national average despite rising interest rates.
CONCLUSION
I’m completely in agreement with what Ryan has suggested above, recognising that Perth is still affordable when it comes to mortgage/income ratios. To paint you a picture, Perth residents devote an average of 30% of their income towards their mortgage repayments, while other capitals such as Sydney have an average of ~60% of their income consumed by their mortgages.
What we see happening with interest rates is heavily influenced by the factors that affect the Eastern states. Meanwhile, Perth is very resilient, and the fundamentals are still strong – including a very tight supply of housing stock, extremely tight rental vacancy rate and strong demand of employment. Building Approvals have reduced over the past year, which will further tighten new housing stock. I suspect this will have an influence on further price demand for new and used housing, including price growth.